Diagrams
📆Calendar heatmap
Data visualization technique
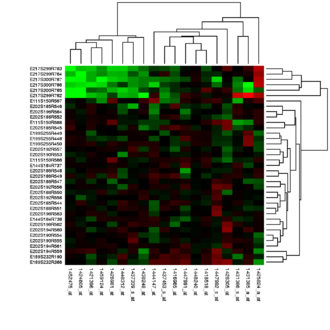
A heat map (or heatmap) is a two-dimensional data visualization technique that represents the magnitude of individual values within a dataset as a color. The variation in color may be by hue or intensity. In some applications such as crime analytics or website click-tracking, color is used to represent the density of data points rather than a value associated with each point. "Heat map" is a relatively new term, but the practice of shading matrices has existed for over a century.
Source: WikipediaClosest relatives
Can you guess diagrams from their family tree?
GuessKin Diagrams is a daily taxonomy puzzle — Wordle meets the tree of life.
Play GuessKin Diagrams