Diagrams
GuessKin Diagrams — 2026-06-18
Reveal the answer for 2026-06-18
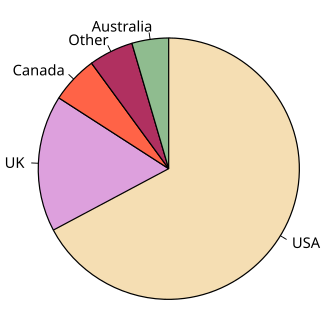
🥧Pie chart
Circular statistical graph of proportionality
A pie chart (or a circle chart) is a circular statistical graphic which is divided into slices to illustrate numerical proportion.